Create a Grafana instance
If you go to the site's management page, you will find a link Access project through OKD console from where you can access the OKD console to continue configuring it. In order to access the site's management page, go to Web Services Portal. Click on the My Sites button, which is placed on the top blue bar. A list of all your sites/projects will be displayed. Find the project that you want to manage and click on it.
Go to the Add tab and click on the Operator Backed category, then choose the Grafana operator.

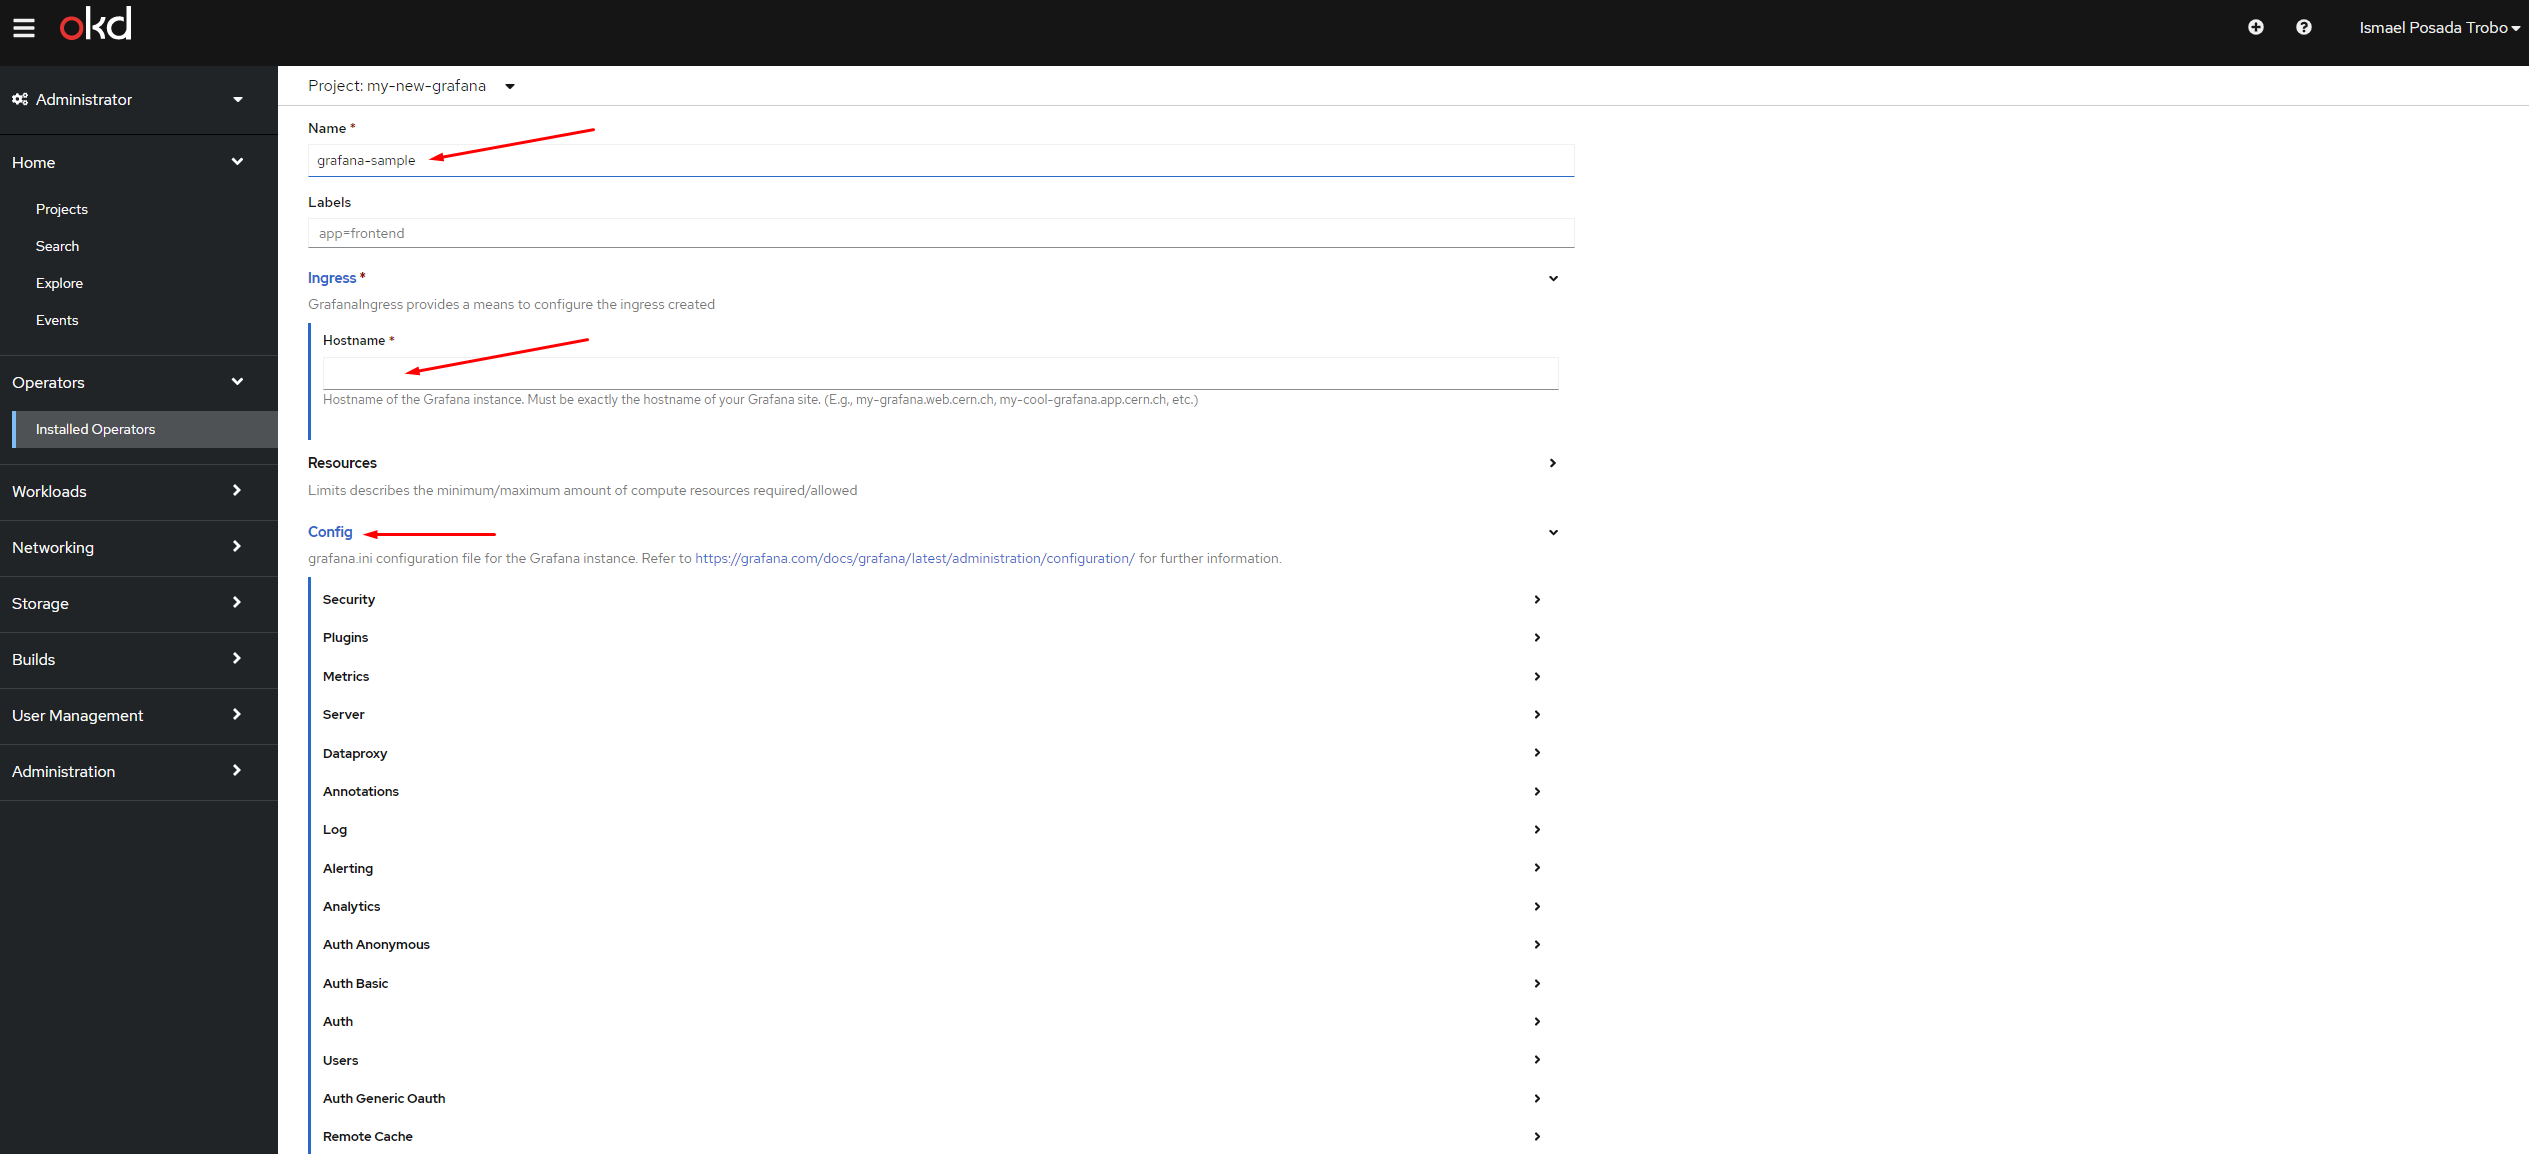
In the instance creation form several fields need to be filled out.
Info
By default, Grafana instances will be created with CERN SSO ready-to-use, and no local admin user will be created. This can be obviously overridden at any point.
First, set an appropriate Name for your Grafana instance. This will help users to identify the Grafana instance under a specific project.
Then, set the Hostname, i.e., the url where to access the Grafana instance to. The hostname must be in either the web.cern.ch domain or app.cern.ch domain, e.g. my-grafana.web.cern.ch, or my-awesome-grafana.app.cern.ch. If using https://app-cat-stg.cern.ch for development purposes, use the webtest.cern.ch domain for the hostname of your Grafana instances.
In case you need some extra configuration for Grafana to run, expand the Config element to do so. Check https://grafana.com/docs/grafana/latest/administration/configuration/ for information about the different elements offered.
Info
By default, Grafana instances use an embedded SQLite database. While it should be sufficient for most instances, very active instances may consider an external database for better scalability.
To set up an external database, request a mysql database from the Database on Demand service, and specify external database
connection details under the Config element as per the Grafana database configuration reference.
If you need any extra plugin for your Grafana instance, you can do it either from the Grafana UI, or by using the Install Plugins element.
Finally, configure the Visibility of the Grafana instance accordingly. This will determine whether your instance is accessible from inside or outside CERN.
Click on Create to launch the creation.
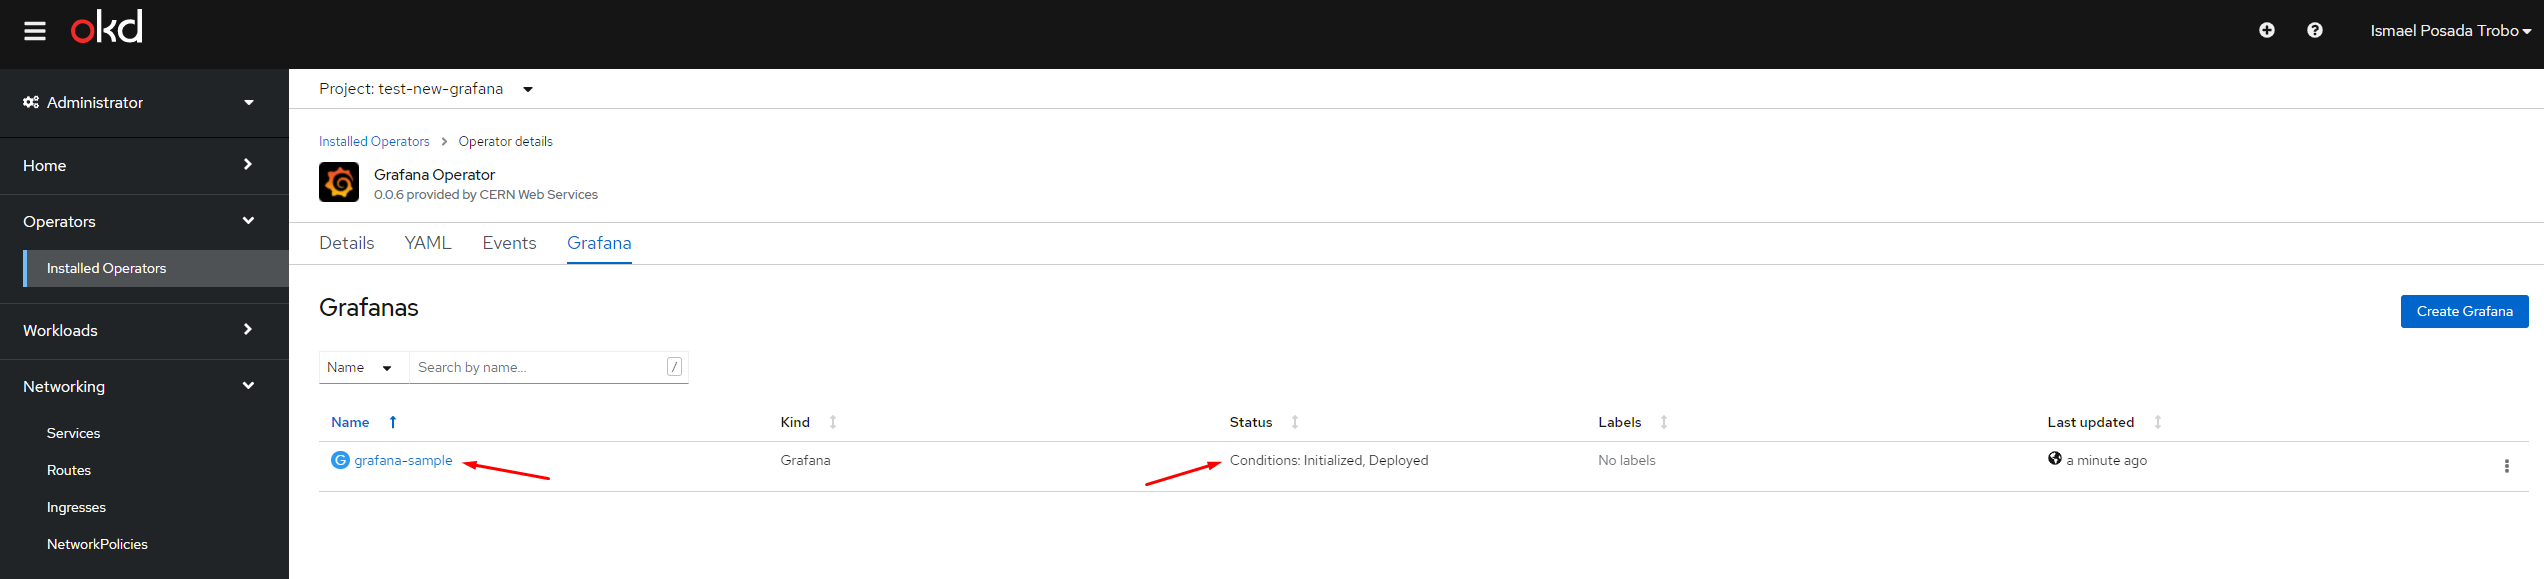
To check whether our instance is ready to use, we can check the status of the installation:
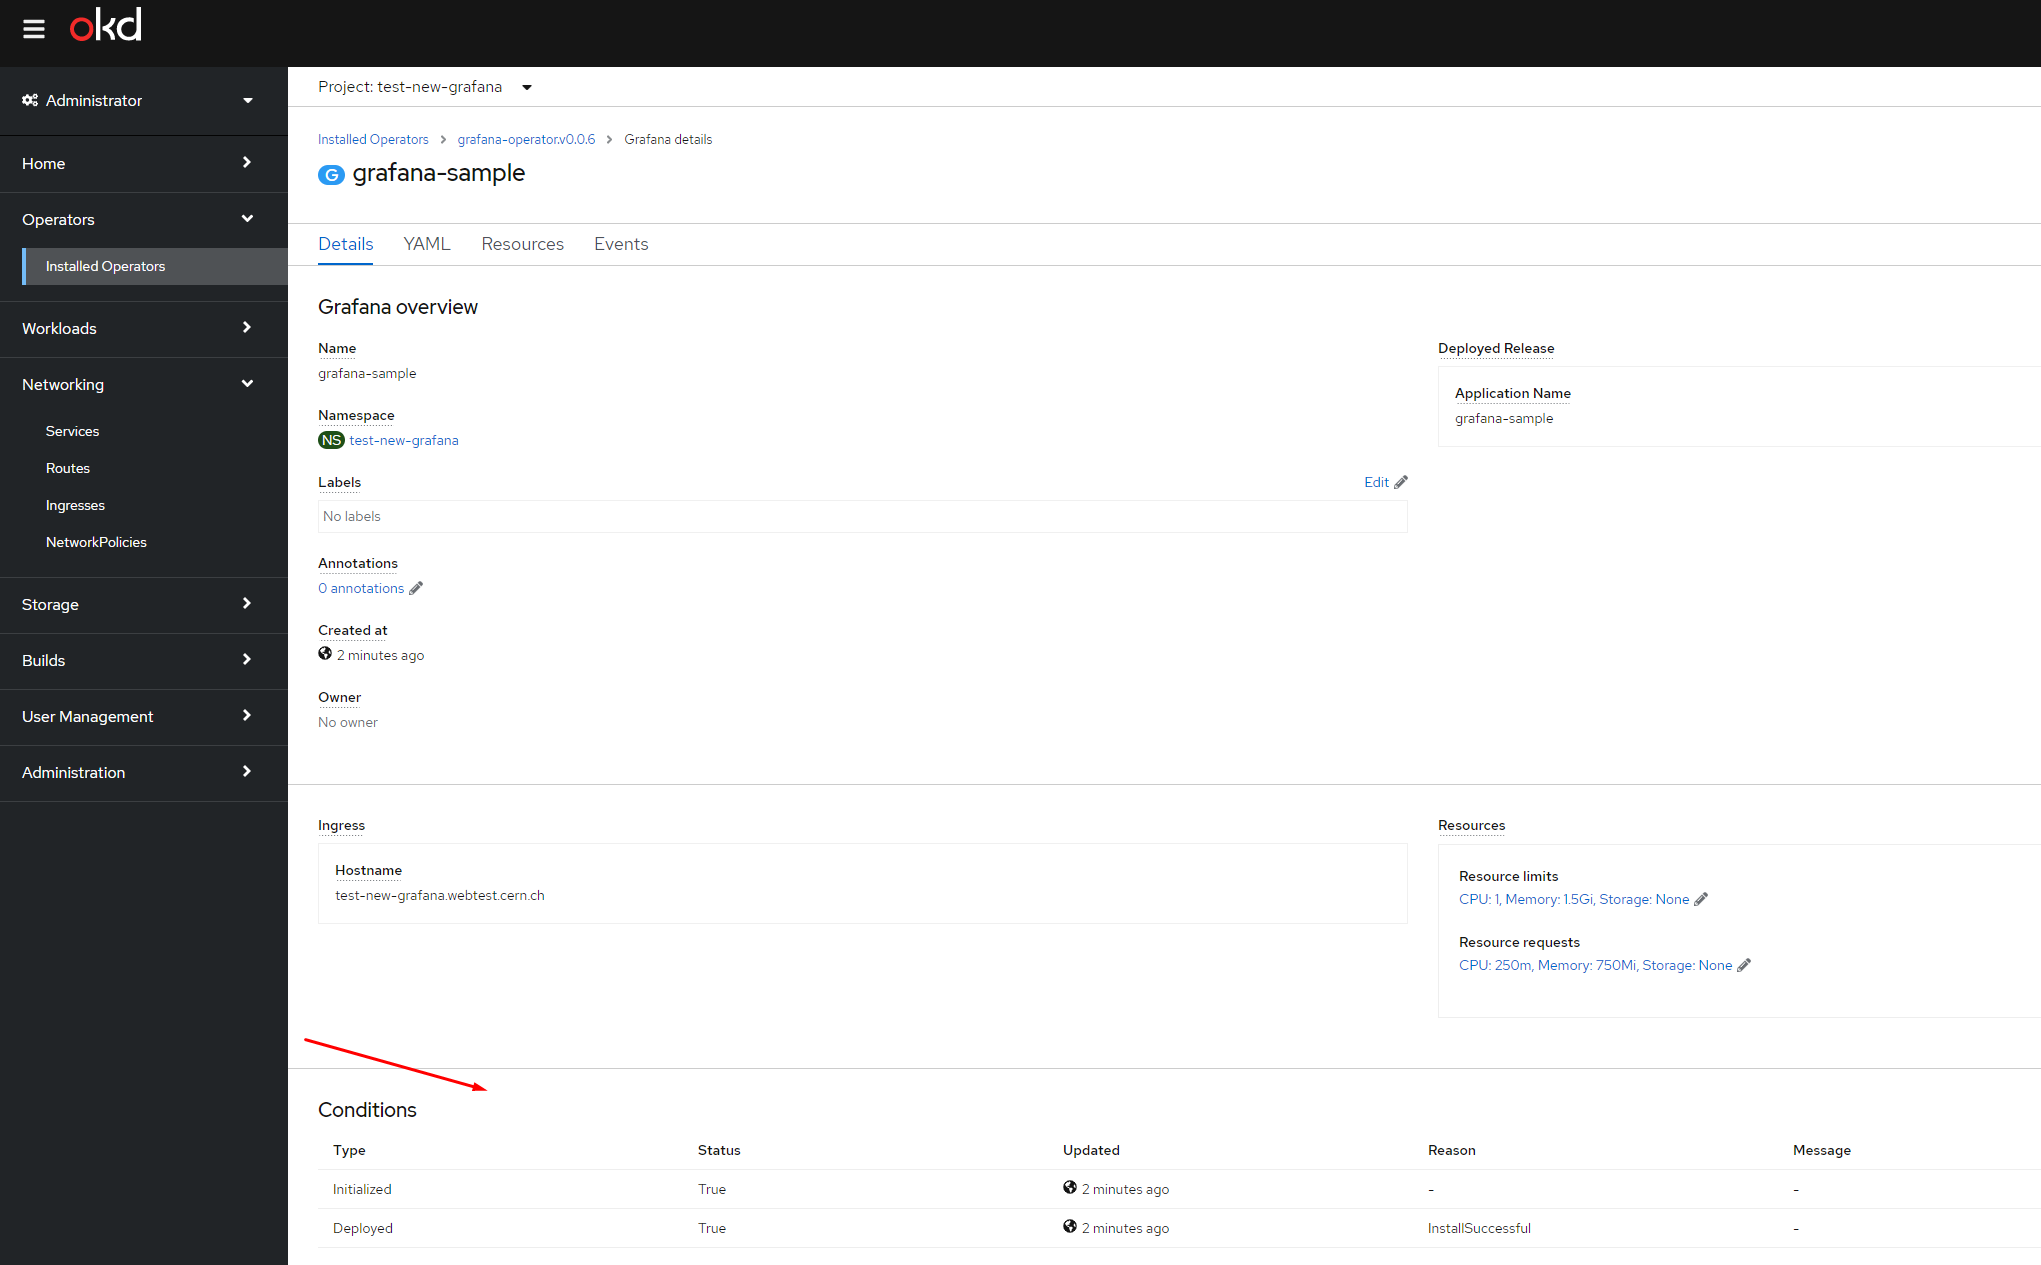
And see the conditions of the installation:
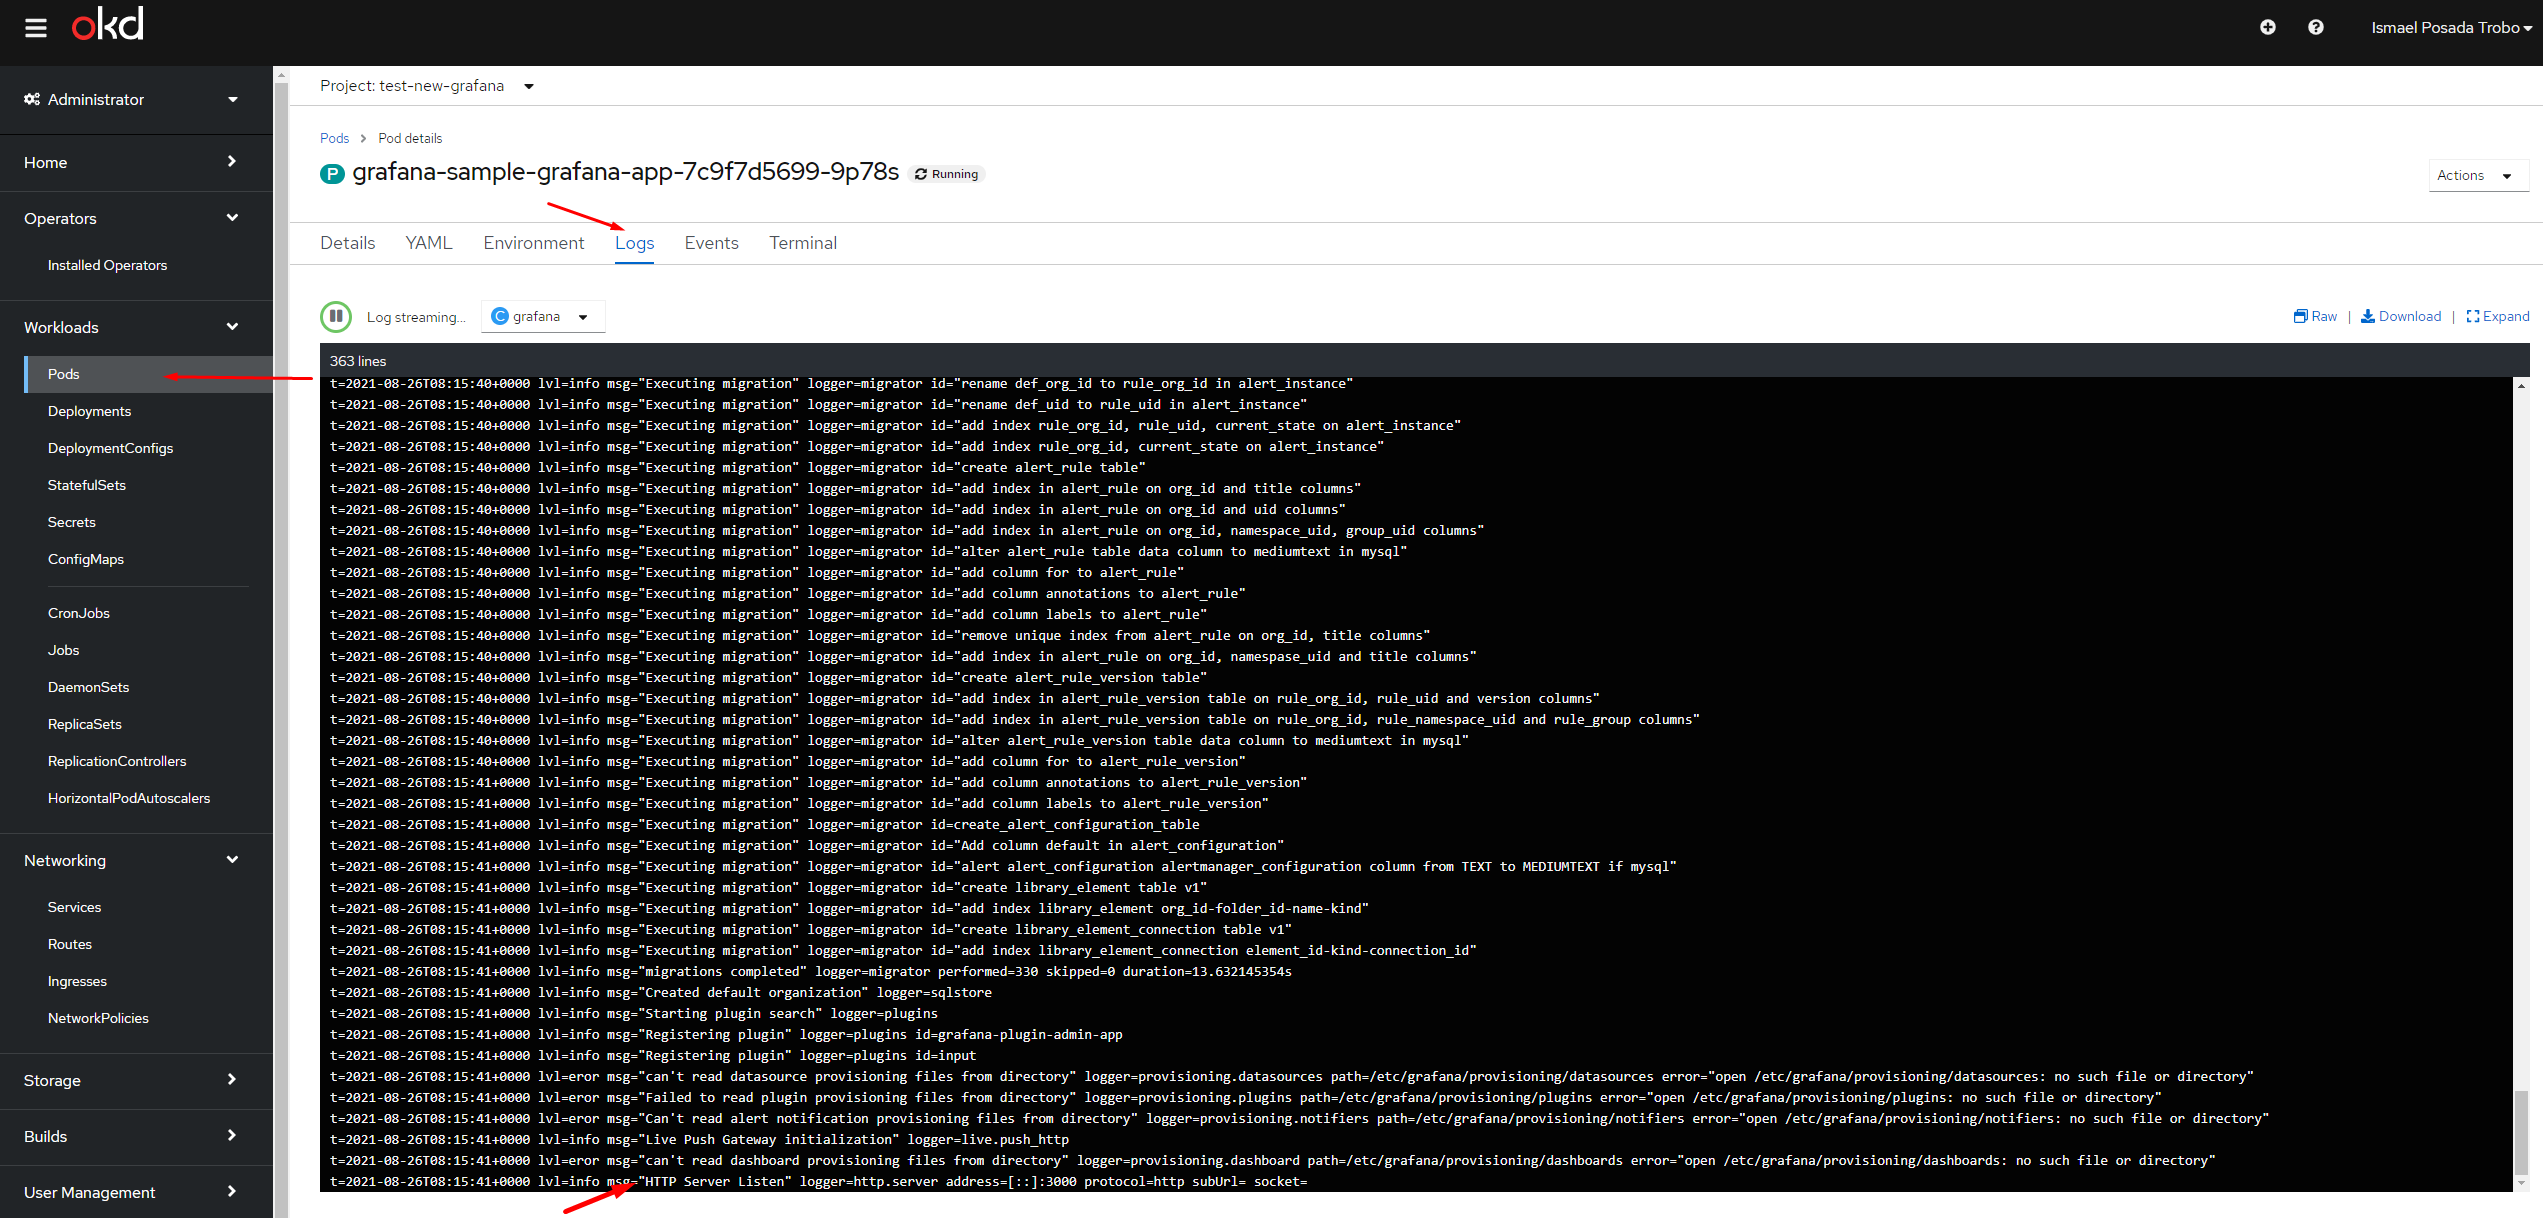
Last but not least, a good indicator that everything is ready it is to visit the pod and check for the logs.