Grafana migration instructions
This guide outlines how to migrate from one Grafana instance to another, e.g. from a user Grafana instance to the CERN MONIT Grafana following the deprecation of self-service Grafana instances (OTG0156301).
Note
Note for non-technical users: We understand that not all Grafana users are familiar with writing or running terminal commands. While this guide provides scripts to automate the migration of dashboards and data sources, all steps can also be completed manually through the Grafana UI.
Steps
- Identify a grafana organization to move your dashboards OR request a new organization.
- Move Data Sources.
- Move Library Panels.
- Move Dashboards.
- Move Alerts (Contact Points, Notification Policies, Alert Rules).
- Due to the discontinuation of support for Angular-based plugins, follow instructions in OTG0155119 to migrate to React based alternatives.
- Delete old grafana instance using the webservices portal.
- In case you want to setup a redirection from the old grafana URL to new URL, open a ticket.
About Using the Scripts
If you choose to use the provided scripts for migrating dashboards and data sources, please note:
- This requires using the command line on a Linux system with standard UNIX tools such as bash, curl, jq, and oc.
- The recommended environment is a CERN LXPLUS machine, which already includes these tools. See related docs
Setup
For the setup, you need to create a service account token for the Grafana instances. See the Grafana documentation for details.
Next, set the environment variables required by the migration scripts:
SRC_GRAFANA="https://okd4-grafana.app.cern.ch" # replace with your grafana instance
SRC_TOKEN="your_source_token"
SRC_ORG_ID="1" # for grafana instances with 1 organization, this is the default value

DST_GRAFANA="https://monit-grafana.cern.ch"
DST_TOKEN="your_dest_token"
DST_ORG_ID="101"
Notes
- To use the script for automating the migration process, token-based authentication is required. You must have an Editor or Admin role with sufficient permissions.
- All scripts set the id to null to prevent conflicts during import. The id is specific to each Grafana instance and may already be in use in the destination instance. By setting it to null, you instruct Grafana to generate a new unique id upon import, which avoids the posibility of overwriting existing dashboards.
Data Sources
Recreate the data sources from the old organization in the new one.
For more details, see the Data sources documentation.
-
Run setup.
-
Then, export data sources and store them as JSON files locally:
# ensure directory exist
EXPORT_DIR="./grafana_datasources"
mkdir -p "$EXPORT_DIR"

# get list of all data sources
datasources=$(curl -s -H "Authorization: Bearer $SRC_TOKEN" "$SRC_GRAFANA/api/datasources?orgId=$SRC_ORG_ID")

# export datasources and store each one a separate JSON file
echo "$datasources" | jq -c '.[]' | while read -r ds; do
  name=$(echo "$ds" | jq -r '.name' | sed 's/[^a-zA-Z0-9._-]/_/g')
  echo "$ds" > "$EXPORT_DIR/${name}.json"
done
for file in "$EXPORT_DIR"/*.json; do
  # remove id to avoid conflicts
  cleaned=$(jq 'del(.id)' "$file")

  # import data source
  response=$(curl -s -o /dev/null -w "%{http_code}" -X POST -H "Authorization: Bearer $DST_TOKEN" -H "Content-Type: application/json" -d "$cleaned" "$DST_GRAFANA/api/datasources?orgId=$DST_ORG_ID")

  filename=$(basename "$file")
  if [ "$response" == "200" ]; then
    echo "Successfully imported: $filename"
  elif [ "$response" == "409" ]; then
    echo "Already exists: $filename"
  else
    echo "Failed to import: $filename with HTTP code: $response"
  fi
done
Library Panels
A library panel is a reusable panel that you can use in any dashboard. For more details, see the Manage Library Panels.
Steps to migrate your library panels:
- Access
Dashboards>Library Panels - For each library panel, view panel in a dashboard by clicking on it. On the dashboard, find the panel that uses the library panel and unlink it. (This will allow the configuration of the panel to pass into the dashboard. Unlinking one panel that uses the library panel is enough. Keep the list with the dashboards/panels that you unlinked. The will be used to recreate the library panels in the following steps.)
- Follow steps to move Dashboards.
- Find the dashboards that you unlinked in step 2., and use them to recreate the library panel in the new grafana instance.
- Fix the other links to the dashboards. At this stage, the other panels that used to reference to the library panel keep refererencing to the panel in the old grafana instance (which does not exist with the same id in the new grafana instance). Delete the panels and add them again OR replace them.
Dashboards
Recreate the dashboards from the old organization in the new one.
For more details, see the Dashboards documentation.
- In your source Grafana, go to the dasboards: https://monit-grafana.cern.ch/dashboards.
- Select a dashboard and click the
Sharebutton: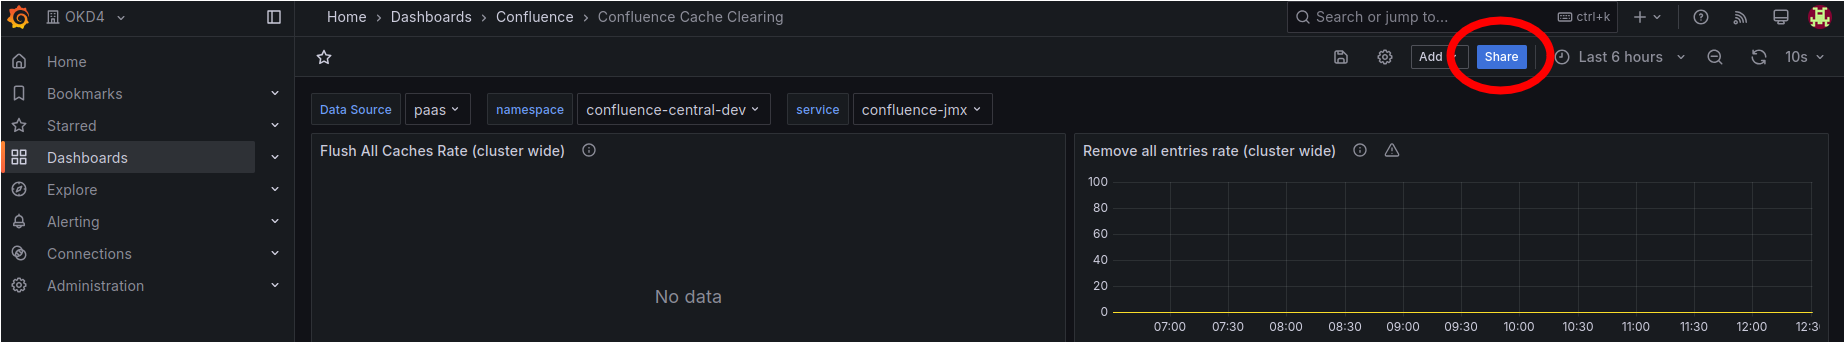
- Click the
Exporttab and enableExport for sharing externally→ Copy the JSON payload - In MONIT Grafana, go to the dasboards: https://monit-grafana.cern.ch/dashboards.
- Select New → Import:
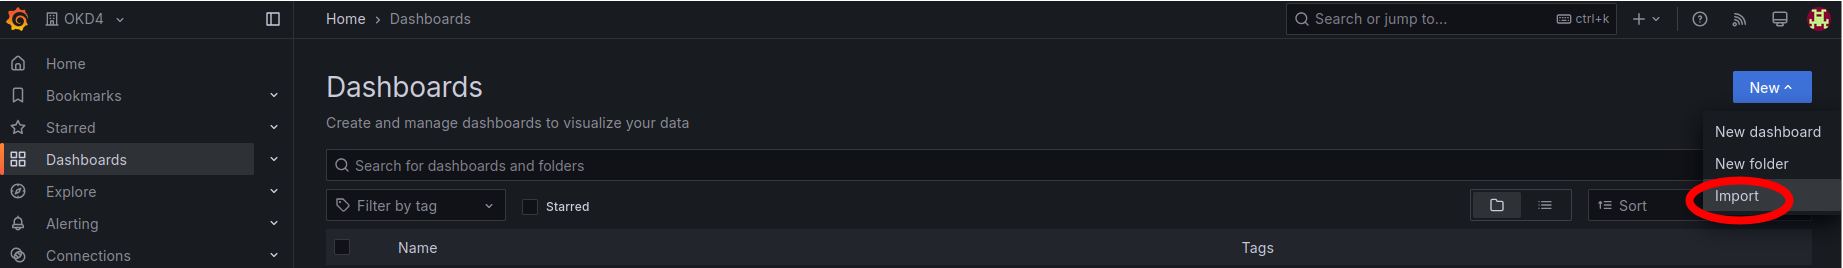
- Paste the exported JSON and follow the instructions to import it
Read more about importing dashboards in related docs.
-
Run setup.
-
Export dashboards from source grafana instance locally:
# ensure directory exists
EXPORT_DIR="grafana_dashboards"
mkdir -p "$EXPORT_DIR"

# get uids of dashboards
uids=$(curl -s -H "Authorization: Bearer $SRC_TOKEN" "$SRC_GRAFANA/api/search?query=" | jq -r '.[] | select(.type=="dash-db") | .uid')

for uid in $uids; do
  # get dashbard json
  dashboard_json=$(curl -s -H "Authorization: Bearer $SRC_TOKEN" "$SRC_GRAFANA/api/dashboards/uid/$uid?orgId=$SRC_ORG_ID")
  # get dashboard's title
  title=$(echo "$dashboard_json" | jq -r '.dashboard.title' | sed 's/[^a-zA-Z0-9._-]/_/g')
  # get dashboard's folder
  folder=$(echo "$dashboard_json" | jq -r '.meta.folderTitle // "General"' | sed 's/[^a-zA-Z0-9._-]/_/g')

  # ensure dashboard's folder exist and save JSON with dashboard's config
  # that allows the creation of the dashboards in the right folder
  mkdir -p "$EXPORT_DIR/$folder"
  echo "$dashboard_json" > "$EXPORT_DIR/$folder/$title.json"
done
get_folder_id() {
  local folder_title="$1"

  # look up existing folders
  folder_info=$(curl -s -H "Authorization: Bearer $DST_TOKEN" "$DST_GRAFANA/api/folders?orgId=$DST_ORG_ID" | jq -r ".[] | select(.title == \"$folder_title\")")

  # folder found
  if [ -n "$folder_info" ]; then
    echo "$folder_info" | jq '.id'
  else

    # create folder
    new_folder=$(curl -s -X POST -H "Authorization: Bearer $DST_TOKEN" -H "Content-Type: application/json" -d "{\"title\": \"$folder_title\"}" "$DST_GRAFANA/api/folders?orgId=$DST_ORG_ID")
    echo "$new_folder" | jq '.id'
  fi
}

# create a temporary file for processing dashboards
TMP_FILE=$(mktemp)

# loop through all JSON files
find "$EXPORT_DIR" -type f -name "*.json" | while read -r file; do
  # get folder name (subdirectory relative to EXPORT_DIR)
  folder_title=$(dirname "$file" | sed "s|$EXPORT_DIR/||")
  folder_title="${folder_title:-General}"  # default to 'General' if root

  # get or create folder id
  folder_id=$(get_folder_id "$folder_title")

  # clean the dashboard: set id = null and wrap in import format
  # set overwrite to true so existing dashboards with the same UID will be replaced.
  jq --argjson folderId "$folder_id" '
    .dashboard.id = null |
    {
      dashboard: .dashboard,
      folderId: $folderId,
      overwrite: true
    }' "$file" > "$TMP_FILE"

  # import dashboard
  response=$(curl -s -o /dev/null -w "%{http_code}" -X POST \
    -H "Authorization: Bearer $DST_TOKEN" \
    -H "Content-Type: application/json" \
    -d @"$TMP_FILE" \
    "$DST_GRAFANA/api/dashboards/db?orgId=$DST_ORG_ID")

  if [ "$response" == "200" ]; then
    echo "Imported into folder '$folder_title': $(basename "$file")"
  else
    echo "Failed to import $(basename "$file") with HTTP $response"
  fi
done

# remove temporarily file
rm -f "$TMP_FILE"
Alerts
To migrate alerts, you must recreate them manually in MONIT in https://monit-grafana.cern.ch/alerting See Alerting documentation.
Components to migrate:
- Contact Points
- Notification Policies
- Alert Rules
Note: Using Grafana’s provisioning API to manage alerts in MONIT disables UI-based editing of those alerts. While the provisioning API can be used to move alerts manually, it makes future modifications more challenging since all changes must be done via provisioning files and reapplied.